
Understanding a company’s financial statements
In this week’s newsletter I’m going to show you how to read the financial reports that get published by a public company.
To someone without a degree in economics they can seem extremely complex, but if you know your way around, you can find insights that help you to understand their challenges and personalise your outreach.
There are three key reports or tables that a company is going publish every quarter:
Profit and Loss (or Income Statement) - how much a company made (or lost) over the period
Balance Sheet - how much a company owns (or owes) on a defined date
Cash Flow Statement - how much cash came in (or went out) over the period
Let’s look at them in detail using Stanley Black and Decker as an example.

This manufacturing company makes tools and products you might use around the house - a drill, or step ladder, as well as industrial products for the automotive and aerospace industry.
They employ 60,000 people and turn over $14.5 billion per year.
We’ll go through their Q3 FY22 results which came out on October 27th.
You can follow along by accessing their Q3 financial summary here:
Profit and Loss
This first statement shows what they sold, and how much it cost them to run the business - in this case they call it a “Consolidated Statement of Operations” but you can tell it is the Profit and Loss because it starts with their sales, and then takes off the costs.
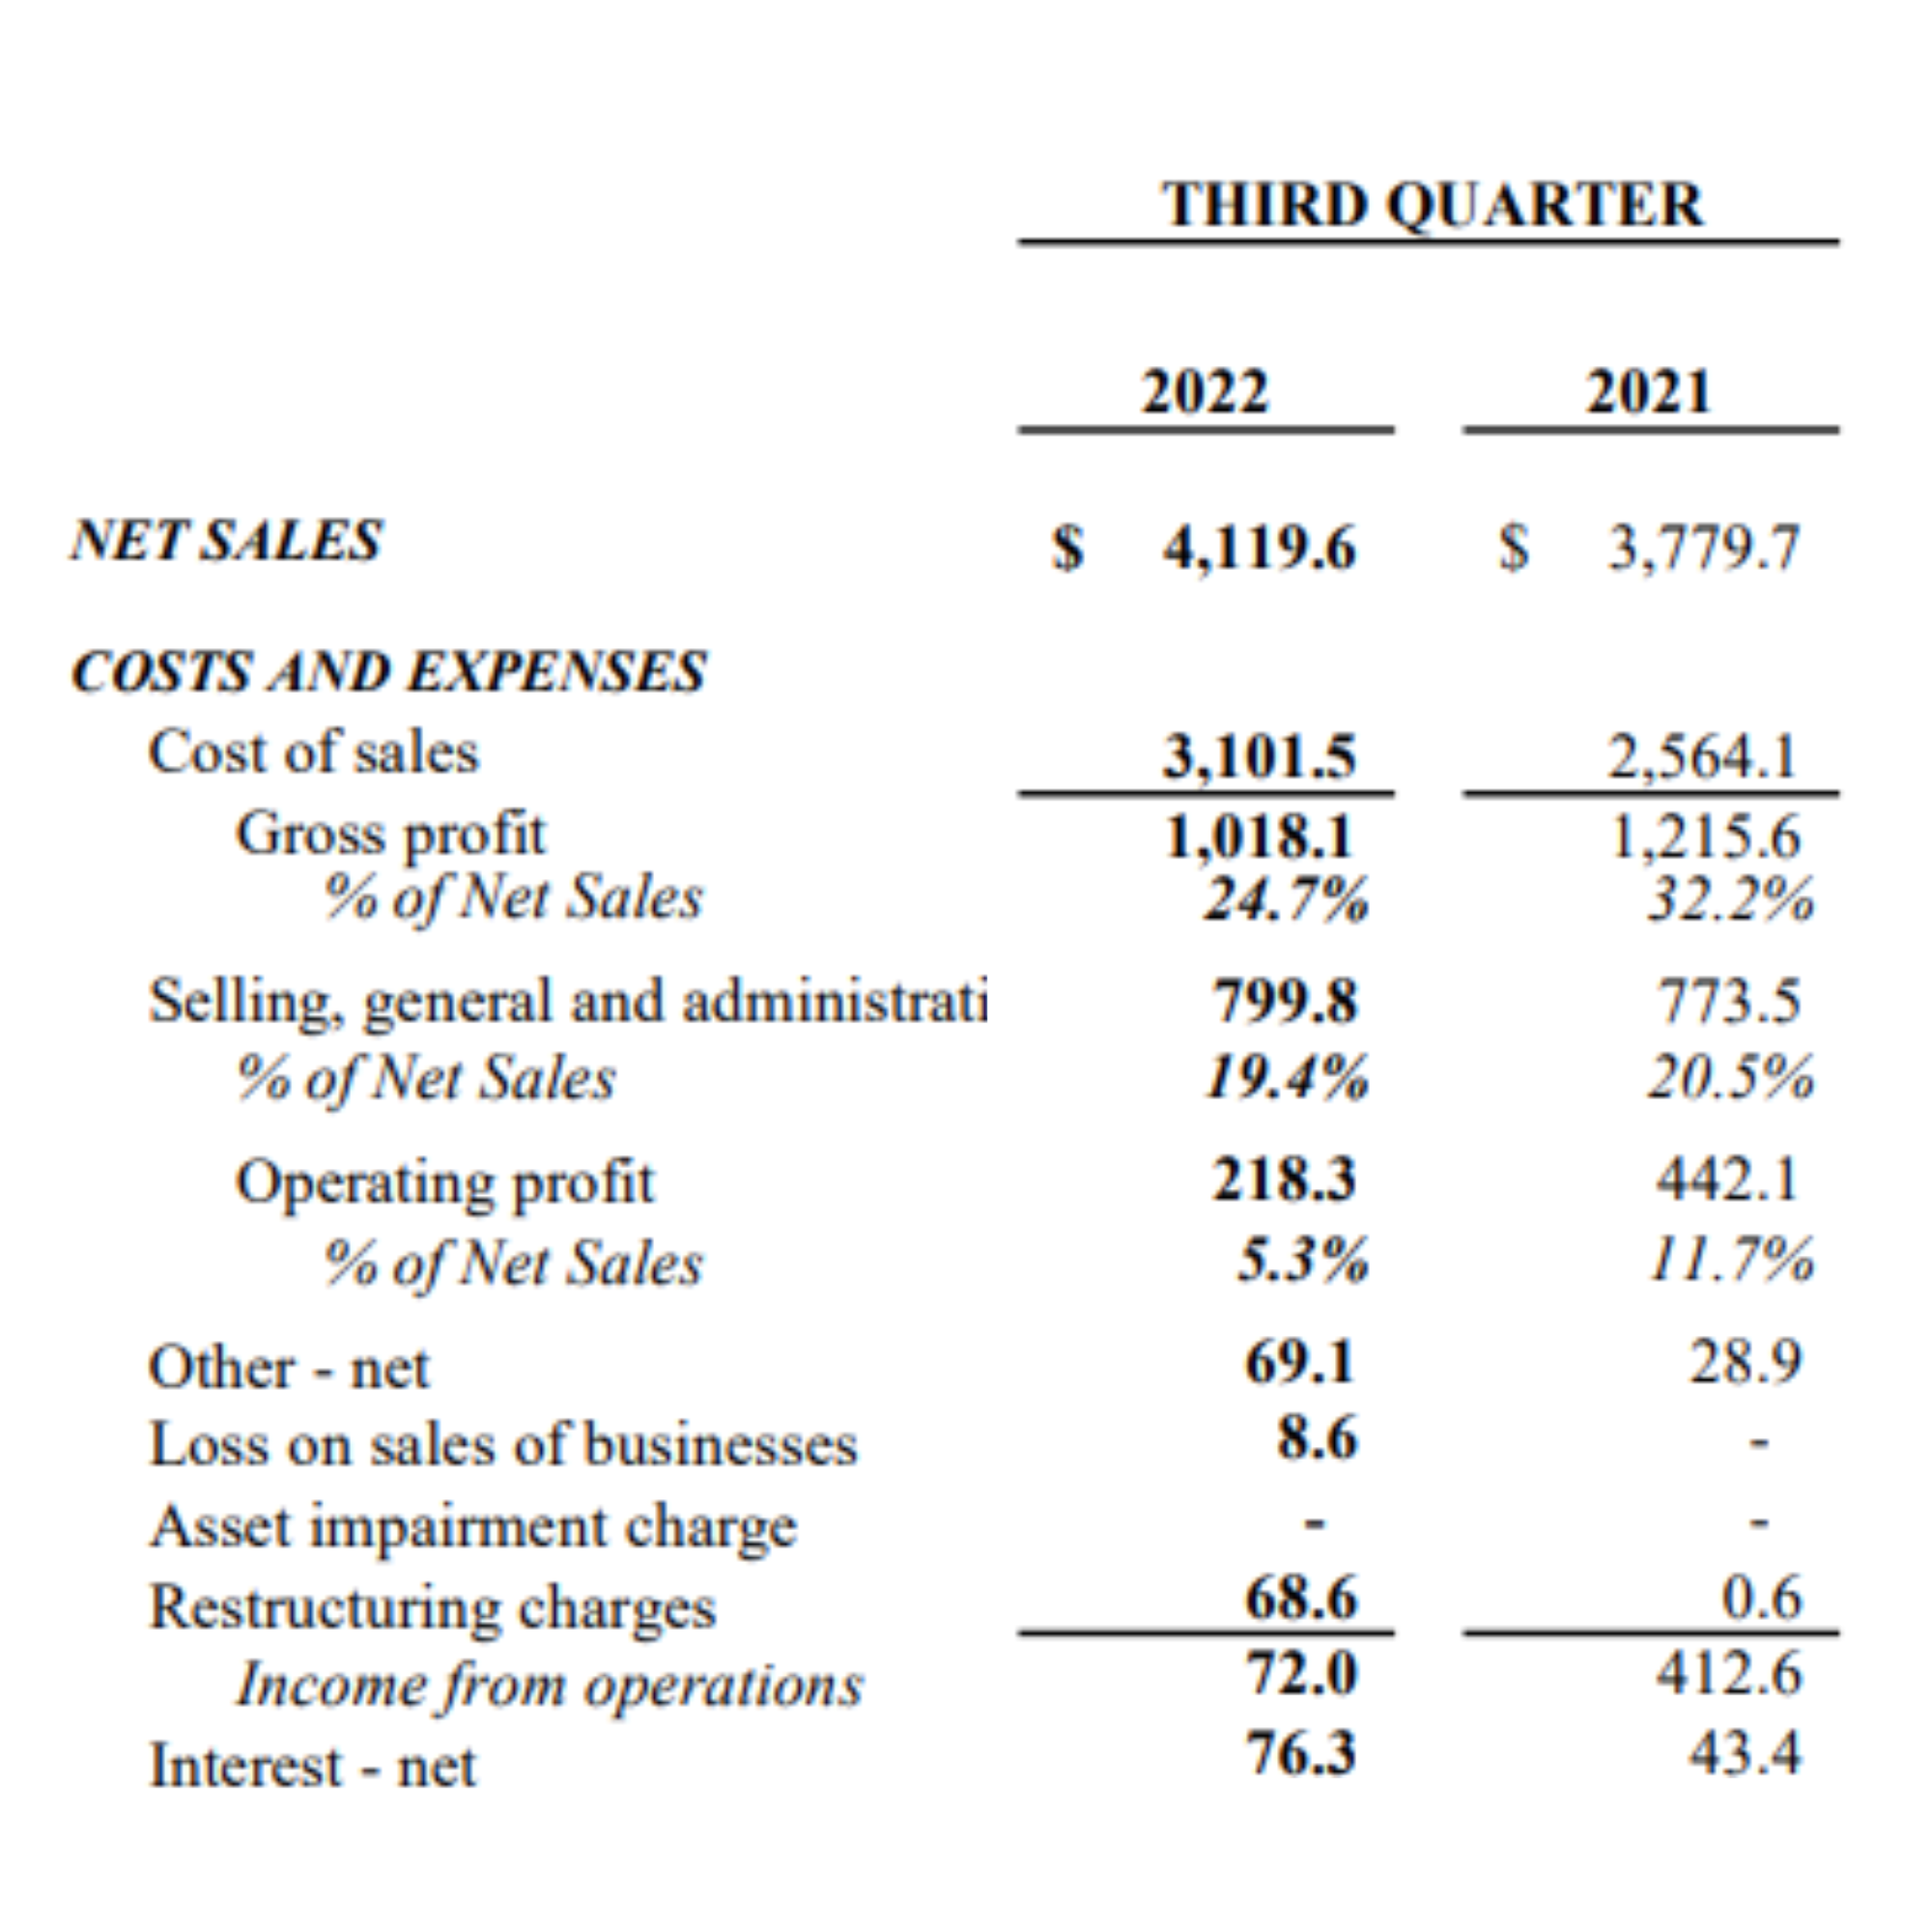
In the last quarter they sold $4,119.6 million (just over $4bn) of products.
But the cost of the materials to make those products was $3,101.5m - this is listed as cost of sales and relates to anything variable that goes into making the product or service sold - steel, plastic, electricity, people.
That leaves a gross profit of $1,018.1 - or a gross margin of 24.7%.
A company needs more than the materials and people to make its products though.
It needs sales teams, marketing campaigns, offices, legal, HR - and these all need to come off next.
Selling, General and Administration (S, G and A) came in at $799.8m, or 19.4% of revenues, leaving an operating profit of $218m or 5.3%
Then there maybe certain one off costs (often described in the notes). In this case the company has been divesting of some non-core businesses and is seeing some additional costs for this process.
This leaves you with their income from operations of $72m - quite a lot less than the $4bn revenue that gets talked about on the investor calls.
After this - further reductions are made for interest, tax and other financial payments - until finally you get to Net Earnings - how much the company made or lost in this financial period.
EBITDA - you might hear this phrase and wonder what it means. It stands for Earnings Before Interest, Tax, Depreciation and Ammortization. It is often used as an alternative measure to Net Earnings and attempts to show the income in a more positive light.
EBITDA is not recognised under Generally Accepted Accounting Principles (GAAP) so you won’t see it mentioned in the financial statements, but may be shown on the earnings presentation as a “Non-GAAP” measure.
What to look for
Trends: is this quarter’s operating profit higher or lower than this time last year? What seasonality can you see over the four quarters? Does the S,G and A margin seem high compared to other companies in their sector? Are there impacts from acquisitions or divestments?
Earnings Per Share: At the bottom of the Profit and Loss you will see “Earnings per Share” where they will divide the net earnings (the money left after all of the costs are taken out) by the number of shares in circulation.
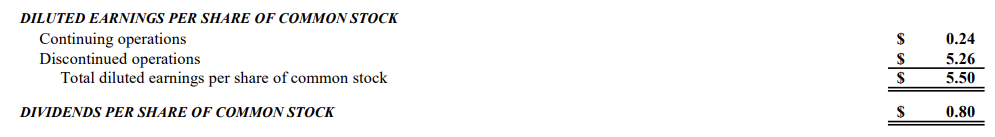
This ratio is commonly used as a measure of health of the business from an investment perspective and they will want to see this going up rather than down.
You can then start to use what you learn in your messaging
“Noticed that S,G and A was 19.4% in the last quarter, and that there are ongoing productivity initiatives in place - what are you targeting for a future S,G and A ratio?”
Balance Sheet
The second table is the balance sheet, which shows what the company owns (assets) and what the company owes (liabilities) on a specific date - in this case the first date of the new quarter - 1st October
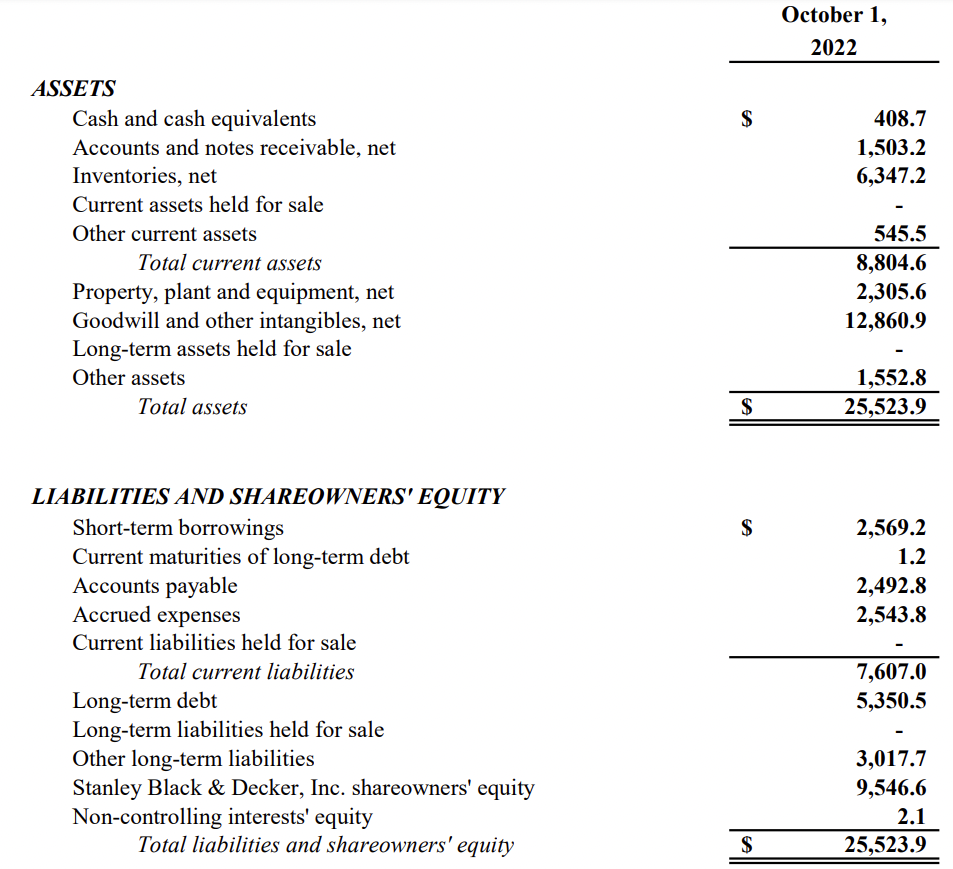
First let’s look at assets - things the company owns.
We have cash - easy to understand.
Accounts and notes receivable - this is money that is owed to the company by customers. They might have invoiced them and that invoice is due for payment next month. It is not cash, but it will be soon.
Inventories are products that the company has made but not yet sold.
All of the above items are what is called “current” assets - that means they are either cash - or can be turned into cash in a few month’s time.
Below that you have “non-current” assets - things that would take a bit longer to turn into cash. Buildings, other companies, large equipment.
Goodwill is a tricky one to get your head around - it relates to the purchase or sale of a company.
Let’s say I buy a company for $2bn, but the actual value of their offices, inventory and cash is $1bn. Then I have paid $1bn in goodwill for their brand, future potential and customer base.
Here we can see Stanley Black and Decker have $12.8bn of goodwill on their balance sheet.
Now let’s look at liabilities - what the company owes to other people.
“Current” or short term liabilities include short term loans, and invoices from suppliers - things that need paying in the coming months.
Then there are “non-current” liabilities that are due further out - a company may have issued bonds, or hold long term property loans.
You will also see shareholder’s equity here. This is not strictly something the company owes to someone else, but it acknowledges that a shareholder owns a part of the business.
You will notice that the total assets equals the total liabilities - it balances, hence the name balance sheet.
What to look for
Trends: Are customers taking longer to pay - is accounts receivable building up? Is cash in the bank reducing? Are the short term borrowings increasing or being paid down?
Look at how much debt the company is carrying and how that compares to their competition.
In this example nearly half of the entire assets of the company is goodwill - that intangible for ‘brand’ and ‘potential’ from acquired businesses.
I’d be interested to dig into that more and understand how the company plans to realise that goodwill.
Cash Flow Statement
They say in business - revenue is vanity, profit is sanity, cash is reality.
Plenty of companies have made a profit but still ran out of cash.
If you need to pay your suppliers in 30 days, but your customers only pay you in 90 days, then it doesn’t matter how much you sell - you will run out of money.

The cashflow statement is broken down into two parts - cash related to running the business (operating activities) and then cash related to financial gymnastics that companies use to balance foreign exchange, inflation, and acquisitions and divestments of businesses.
In this example we can see that the company had an outflow of $425.6m from this quarter’s operating activities.
That looks bad - but we can see that the majority of that is an outflow of $1,220m as a loss on the sale of a discontinued business which we might want to ask more about.
In the financing section we can see $4,146.9m coming in from sales of businesses, and this has enabled the company to deliver a $3,263.4m repayment of short term debts. All items that give us insight into how the company is re-organising itself for future success.
What to look for
Trends - ultimately is cash coming into the business or flowing out. A company can only keep money flowing out of the business for so long before they run out - so seeing an increase in cash held (in this case of $106.5m) means the company is heading in the right direction.
Stock Buy Backs - this will show up in the investing and financing section. Companies buying back their own stock can show confidence that they have the cash on hand, but also nervousness about their stock price.
So there you have it - these three statements will appear every 12 weeks for every public company, and once you know how to read them you can find valuable insights that can help you understand the economics of the business and how your solution might be able to help them.
See you next week,
Whenever you are ready, there are three ways that I can help you:
The SDR to AE Promotion video course. In 90 minutes I’ll help you plan for and execute your AE interview process. My exact process for getting job offers.
Get How To Sell Tech as a paperback, hardback, Kindle or audiobook for a deep dive on how to hit your target in your first sales role.
Become a member of our Research Hub where we publish up to date industry and account analysis to help accelerate your research and personalise your outreach.