
Calculate your commission and aim for extreme outcomes
In this week’s newsletter I’m going to show you how to calculate what your potential earnings might be at differing levels of performance.
You’ll find this useful as you plan out your strategy for the coming year.
If I asked you how much will you earn if you hit 175% of target, would you know the answer?
If I asked you how much you would need to close to earn 3x your OTE would you know the answer?
Most salespeople wouldn’t.
A common scenario is that at the start of the year the commission plan is released and you connect two numbers together - your On Target Earnings and your quota.
“If hit my target then I know what I will earn.”
This then becomes the goal.
But little to no thought goes into what happens when you exceed your target - and that is where the top sellers really maximise their earnings.

Source: Brandon’s LinkedIn Post
By understanding what happens with extreme outcomes you get two benefits:
You motivate yourself to achieve that goal - if you see it you can believe it
You build a plan back from that extreme goal, not the arbitrary ‘average’ set by your revenue ops team.
Calculating this will take you no more than an hour of your time, and it will be one of the most valuable hours of your year.
Step 1 - Gather your information sources
Your OTE or potential commissionable earnings.
This should be well known to you - this is your potential earnings if you hit your target. This is normally described in your contract of employment.
You are looking for the commission element of your earnings, excluding your basic salary.
Your commission plan
This is normally provided at the start of the financial year, or soon after you join if starting mid-year.
It will describe the mechanics of the plan, the metrics being used to calculate commission -
Annual Recurring Revenue
Total Contract Value
Contract Length
Bookings versus Billings
Services and Non-Recurring Revenue
SPIFFs (any product specific incentives)
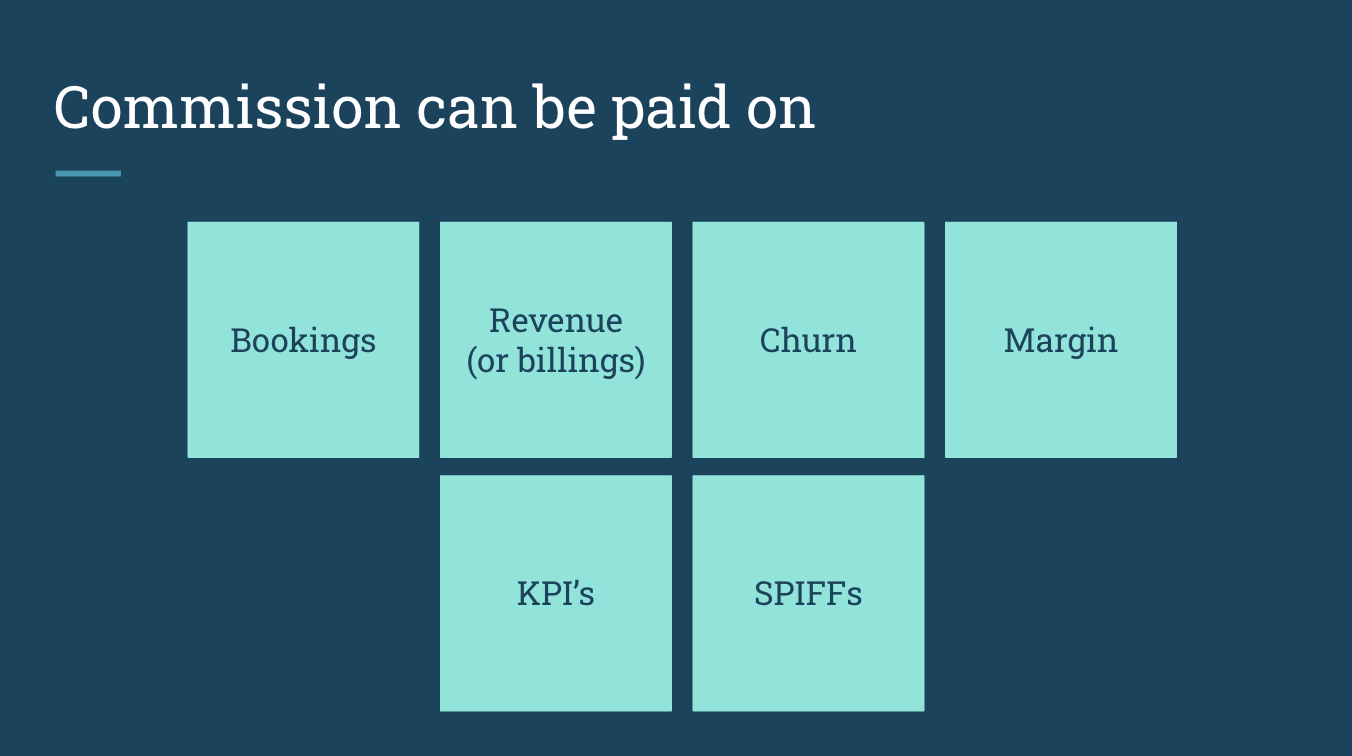
Whilst there may be many dimensions - there will be one key metric (normally bookings) that your company is thinking about when they discuss progress to target so focus on that.
Accelerators or Decelerators
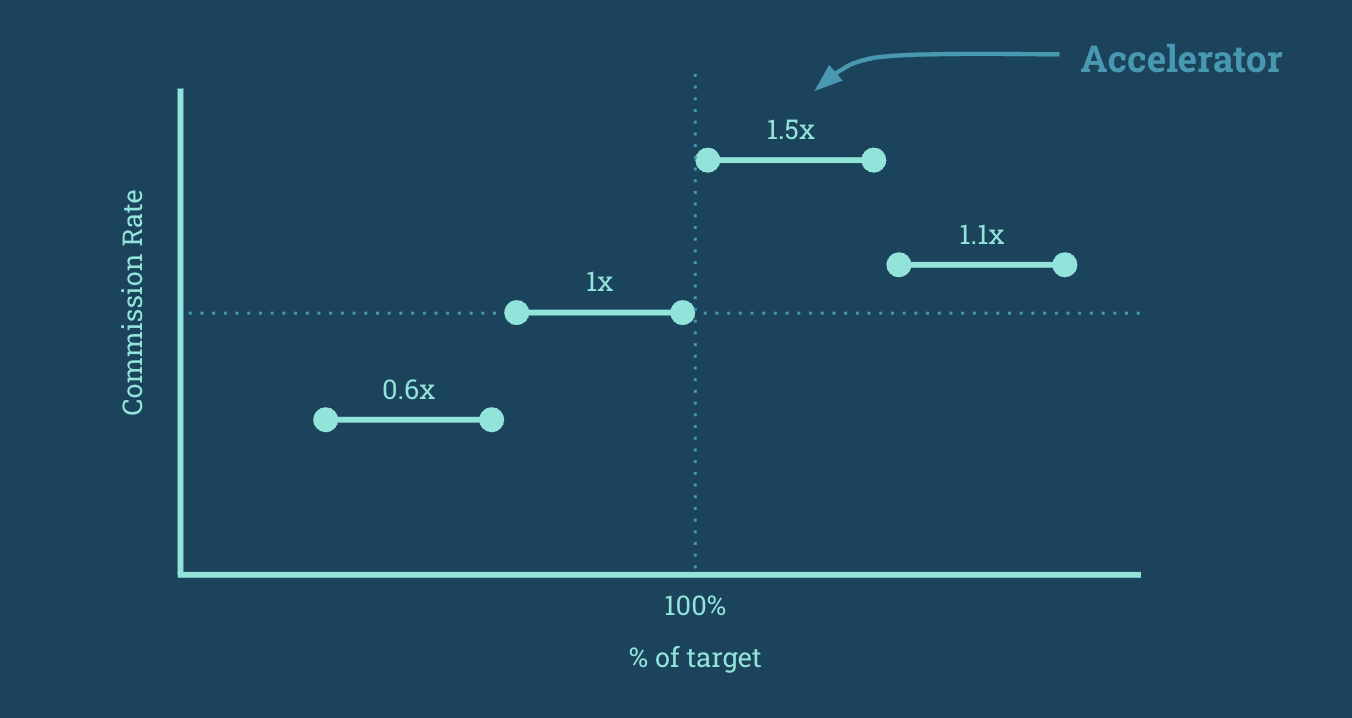
At 100% of target you will typically earn 100% of your commission - a 1:1 relationship - 1x
Many plans will include accelerators if you go beyond 100%, and some will include decelerators for performance under 100%.
An accelerator might pay 1.5x or 2x for any performance past 100%
A decelerator might pay 0.6x for any performance under 50%
A commission calculator (if your company provides it)
Some companies will provide you with a tool or spreadsheet to help you plan out different commission scenarios.
If you have this, fantastic. If not, don't panic as you’ll create some examples yourself.
Step 2 - Map out examples at different levels of performance
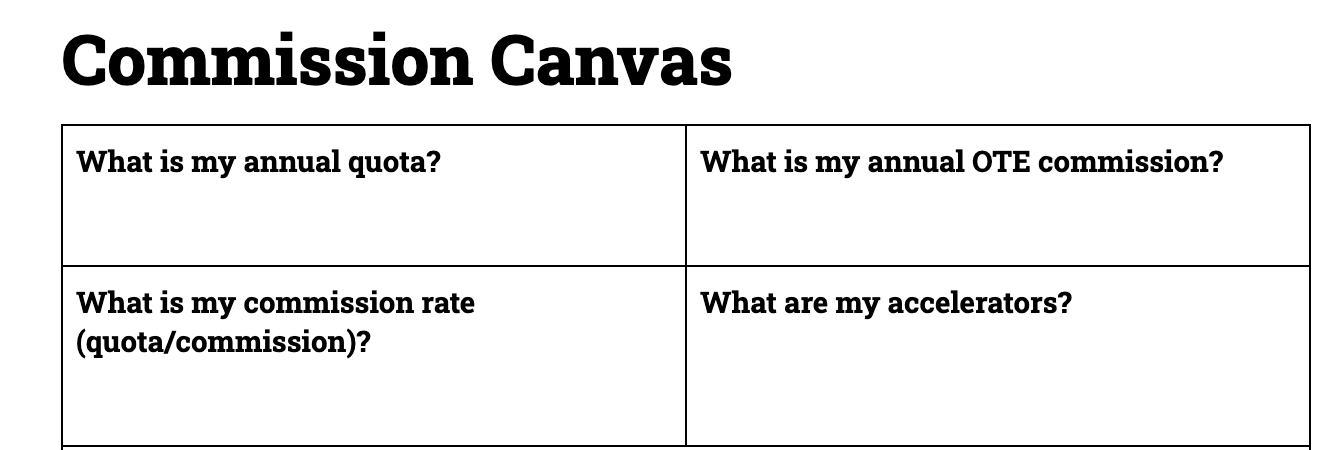
I’ve provided you with a commission canvas to use for doodling and mapping out different examples. You’ll notice it does not contain options for anything under 100%. After all who plans to fail?
Print out the canvas so you can doodle on it. Start to fill in the information you have uncovered.
You could create this as a spreadsheet, but the danger here is that you quickly get tied up building complex formulas “If I sell these products, and attach these services, and they sign on a Wednesday….”
Some commission plans are clean and simple - you have one main metric and clearly defined accelerators.
Other commission plans are more complicated - with multiple competing dimensions and many potential outcomes.
If your commission plan is overly complex then you’ll want to make some broad assumptions about the types of deals you are likely to work on. Your goal here is to work out the most likely outcome, not map out every possible scenario.
Look at each level of performance against your main metric (likely bookings or billings), apply the relevant accelerator, and calculate a number for your commission.

Commission up to 100% - this is easy - it is your OTE commission from your contract
Commission over 100% - this is where with a calculator and a pen you can work out how the accelerators will affect your earnings.
I’ve given you a completed example at the bottom of this article to give you the idea.
Get excited.
Once you have filled this out, if your accelerators are 1.5x and above you should see that the earnings you can make beyond 100% start to dwarf your OTE.
This is how top sellers start making 7 figures (the $1m club).
Step 3 - Understand what needs to happen to make it true
Its not enough to stop here and just be excited about the potential earnings.
You need to work backwards from these ‘outputs’ and determine what ‘inputs’ are required to get there.
How many closed deals will be required?
How many opportunities will you need to add to your pipeline each month?
How you complete this section will vary depending on whether you sell large volumes of SMB deals, or a small number of large Enterprise deals - so use your judgement.
You should be able to calculate your average deal size, or if new to the team your manager will be able to advise you.
You should also have a good idea of the average close ratio. Typically 1 in 4 is a good measure.

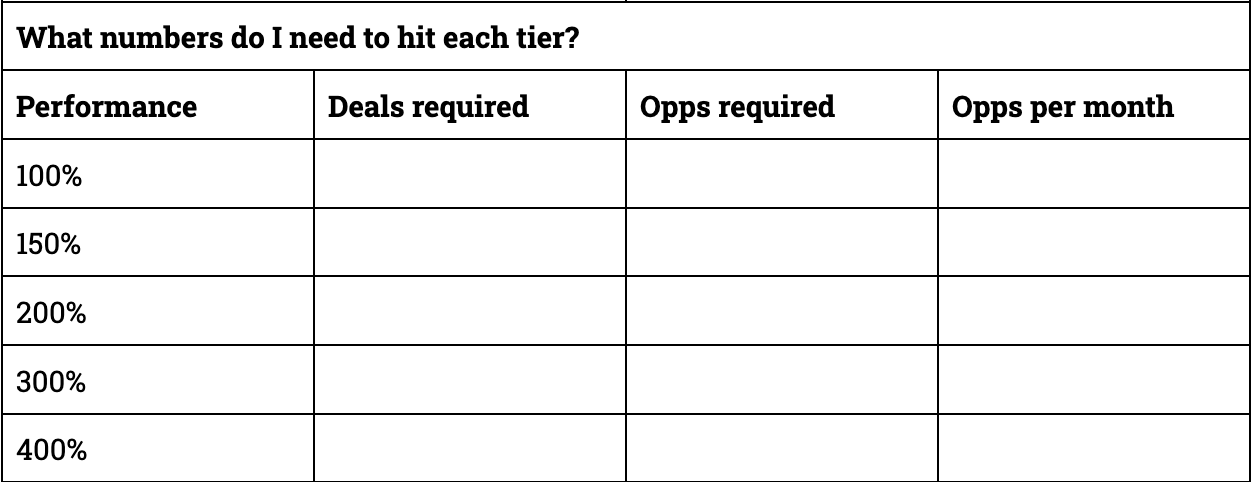
Pick up your calculator again and start to work out how much of the key metric (bookings or billings) you will need to hit each level of performance.
Now divide that by the average deal size and note down the number of deals required.
Now multiply by 4 (for the 1 in 4 close ratio) and note down the number of opportunities required.
Finally divide by 12 to note down the number of new opportunities you need to add into your pipeline each month.
Step 4 - What can you do to improve your chances?
Your canvas should now have some numbers in it that make you feel uncomfortable. Maybe the number of deals required looks completely unachievable. Maybe the number of new monthly opportunities required is not realistic.
In the bottom section start to think through how you might solve that problem.

Could you increase your average deal size (meaning less deals are required)?
Could you improve your close ratio (meaning less opps for the same number of deals)?
Can you work with marketing to launch some specific campaigns to drive more pipeline?
Instead of losing faith in the extreme outcomes you have mapped out - focus on what you can do differently to make them possible.
Step 5 - Tidy up and print out
Now you have completed your canvas it is time to reopen the document in Google Docs or Word and start to fill it out using the doodles you have on the paper version.
Print out your clean version and stick it where you are going to see it and be reminded of it.
Next to your desk, in your diary, on your wall - keep it visible.
Bring it to your next 121 with your manager and walk them through it. Ask them for any comments and for their support in helping you achieve these extreme outcomes.
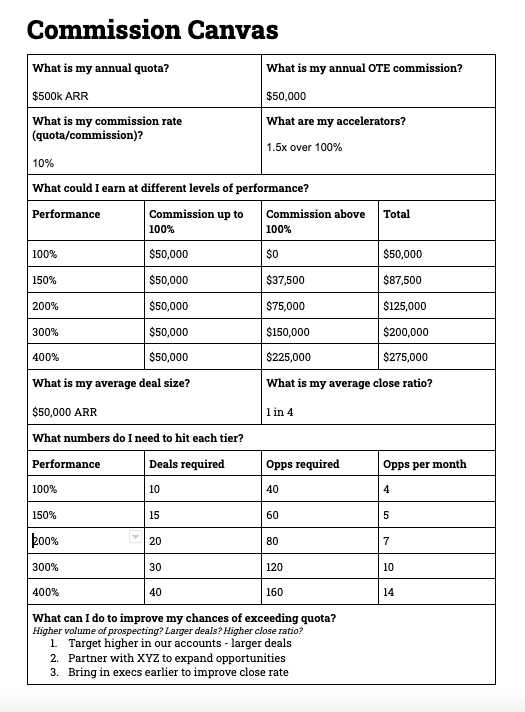
An example with easy numbers to show a finished copy
Good luck.
I can’t promise that by filling out this canvas you will earn 3x your commission.
But I can guarantee you will have more chance of achieving that goal than the seller who is aiming at 100%.
I hope you enjoy putting it to work.
See you again next week.
Whenever you are ready, there are three ways that I can help you:
The SDR to AE Promotion video course. In 90 minutes I’ll help you plan for and execute your AE interview process. My exact process for getting job offers.
Get How To Sell Tech as a paperback, hardback, Kindle or audiobook for a deep dive on how to hit your target in your first sales role.
Become a member of our Research Hub where we publish up to date industry and account analysis to help accelerate your research and personalise your outreach.