
5 slides to use in sales calls
In this week’s newsletter I will show you five slides that I use in my sales calls to help with discovery or to explain a part of our offering.
Today we work in a world where the vast majority of our customer interactions are digital.
Gartner predicts that by 2025 80% of the buyer journey will be digital - so we have to assume that for most of our synchronous interactions the customer will be on a video screen in front of us.

“Discovery” calls can feel like interrogations - whether done by an SDR or an AE.
“How does this work"?”
“Why is that a problem?”
“What have you tried before?”
For the customer it feels like they are being shot at by a question machine gun.
I find that by flashing up a very simple slide with a graphic that I have drawn to explain what I am asking and why helps the customer to understand more easily, and gives them a reference point to think through their answer.
Here are five simple templates I work from.
The process
So much of business is a journey.
The way things were, to the way they will be.
I use a simple set of arrows and put a word under each.
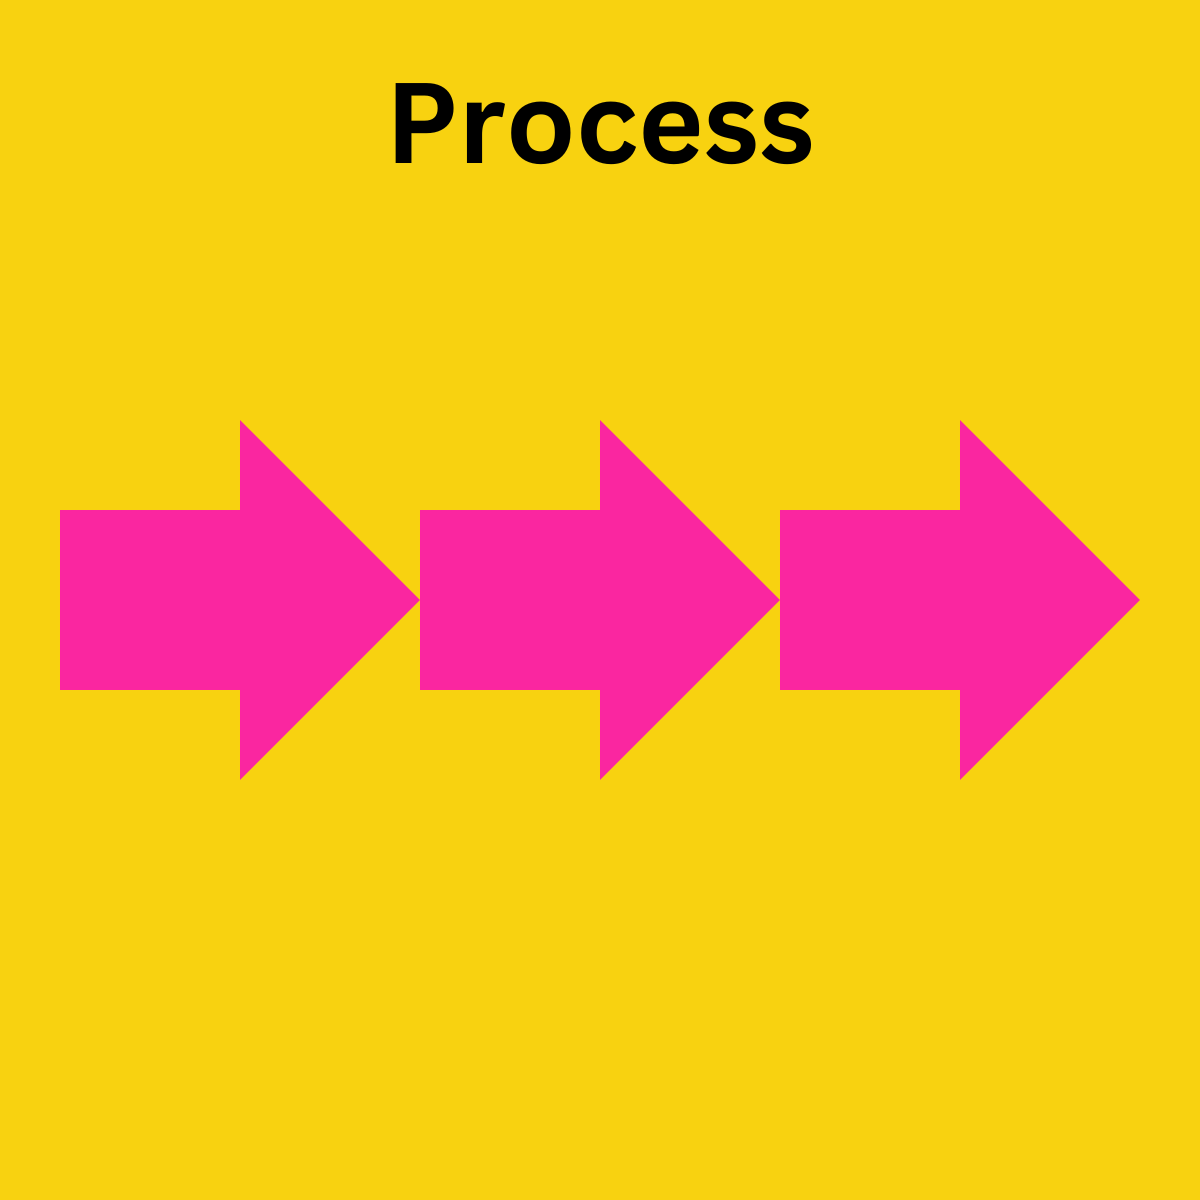
Let’s say I wanted to talk about the shift to remote selling - I might have in-person, pandemic and virtual listed under each arrow.
This simple graphic allows me to explain what we’re seeing, and enquire if the customer sees a similar trend.
The comparison
As a seller you are a guide for your customer.
Option A versus Option B
One year versus three years
One module versus a platform
It can be easy to drop all of this information into a table or document - but for a video meeting that level of detail is hard to consume.

Instead I use very simple bar charts to illustrate some of the decisions that a customer might want to make as they compare different options.
I’m not making an actual graph with a detailed scale - just large rectangles with a representation of the differences to frame the discussion.
The graph
Customers find it very helpful to understand trends in their industry or their usage of products.
You might have a graph showing rates of inflation over time, or their product adoption by different teams.
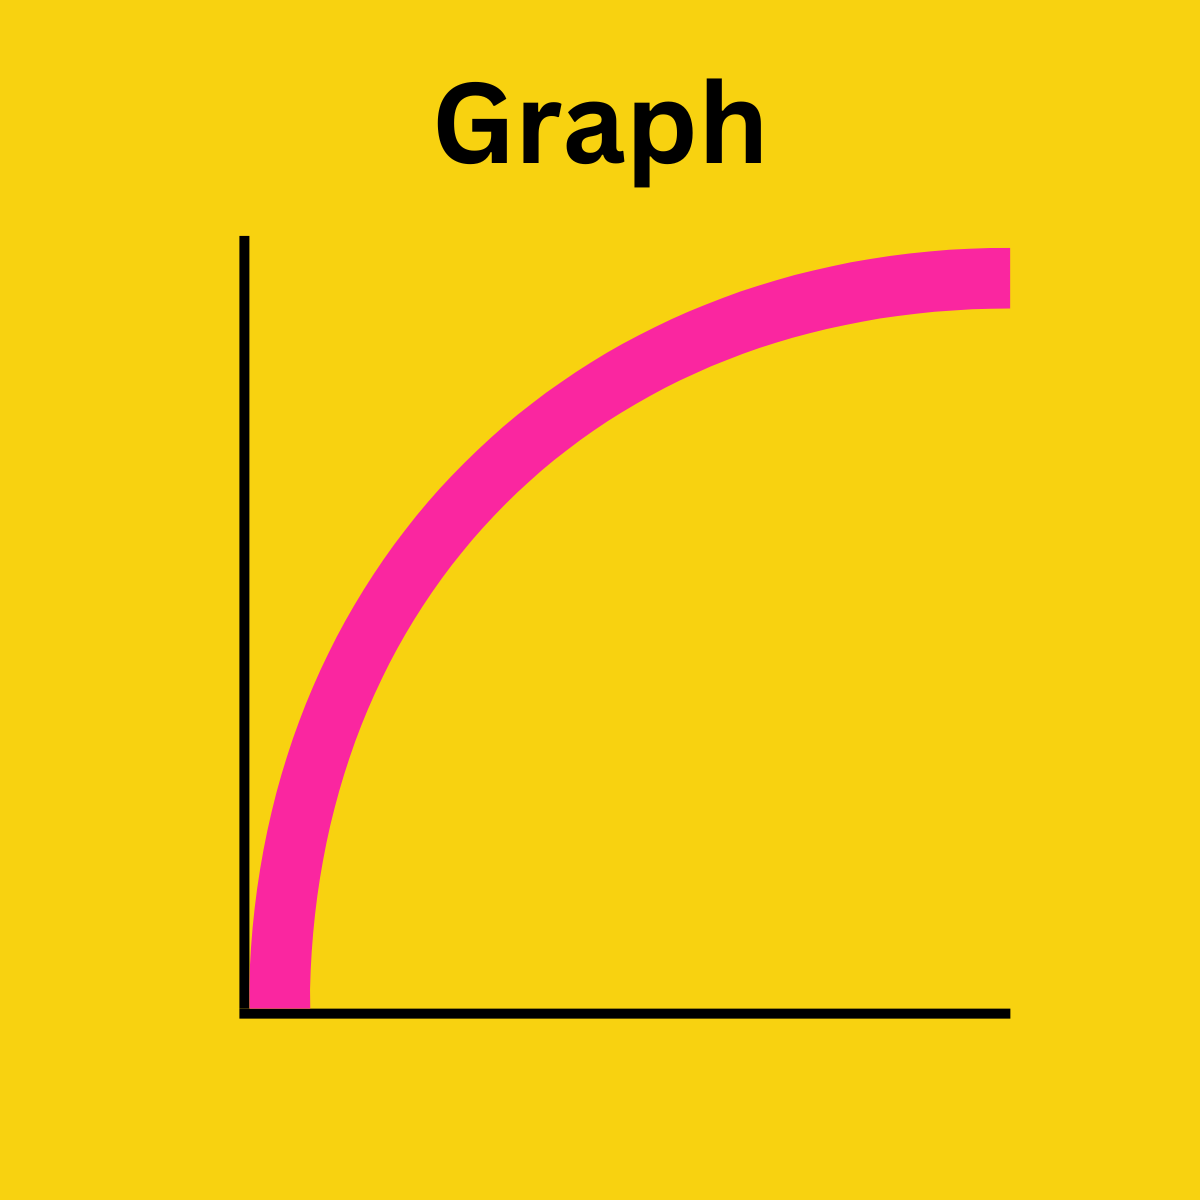
A graph tells a story, and gives you the ability to tell that story to your customer with the image as a backdrop.
Pie charts are OK, but line graphs or barcharts introduce time as a variable which brings the story to life.
Relationships
Customers are interested in two types of relationships - teams and technology!
Teams are org charts - either in their own company, your company, or a mixture of both.
For my key customers I always build out a simple org chart of who I know (or want to know) in their company and show this on the call. It validates that I am right, or more likely, I get corrected and can fill in the blanks.
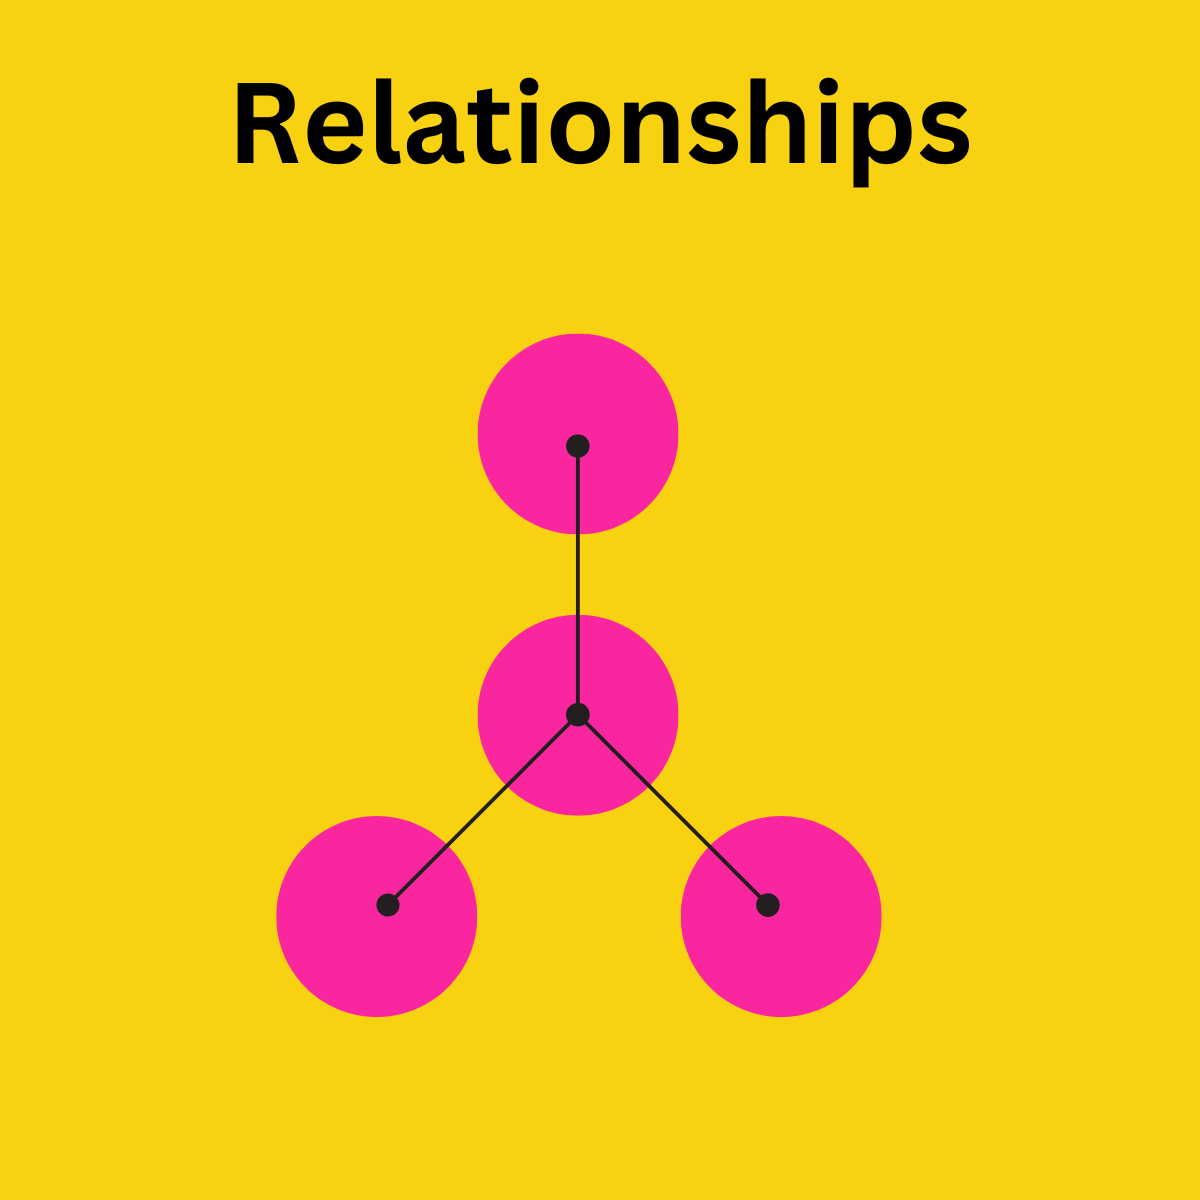
Technology is architectural diagrams - but not super complex ones built by a solution architect. I think of simple concepts that show how systems might interact with each other or data might flow.
As an example - for many years I worked for an early cloud anti-virus company, and I used to draw this picture to show how email flowed into one of our “Towers” and through five different scanners before being sent onto a customer’s network.

Overlaps
The final simple slide is to show the overlaps between two concepts - you’ll know it as a Venn diagram from school.

I use these to show how what I know about the customer’s company or industry overlaps with what I know about our company, our solutions, our partners, our other customers.
This allows me to demonstrate my unique perspective and that I have some insight that the customer cannot get from anywhere else.
Five simple slides
I have these five templates in a single deck, and I’ll copy and make small edits before each customer call so they are relevant to this customer’s business.
I don’t ‘present’ them, they are there as a backdrop, just as if I would have drawn on a whiteboard in a meeting room.
“Sarah, while you are answering that, let me just flash this graphic up as it may help guide what you are explaining…”
So that’s it, until next week!
Whenever you are ready, there are three ways that I can help you:
Get How To Sell Tech as a paperback, hardback, Kindle or audiobook for a deep dive on how to hit your target in your first sales role.
Subscribe to Research Hub where we publish up to date industry and enterprise account analysis to help accelerate your research and personalise your outreach.
CxO Advisory where I help senior leaders with strategic challenges holding back their revenue engine.