
Dollar General Corporation

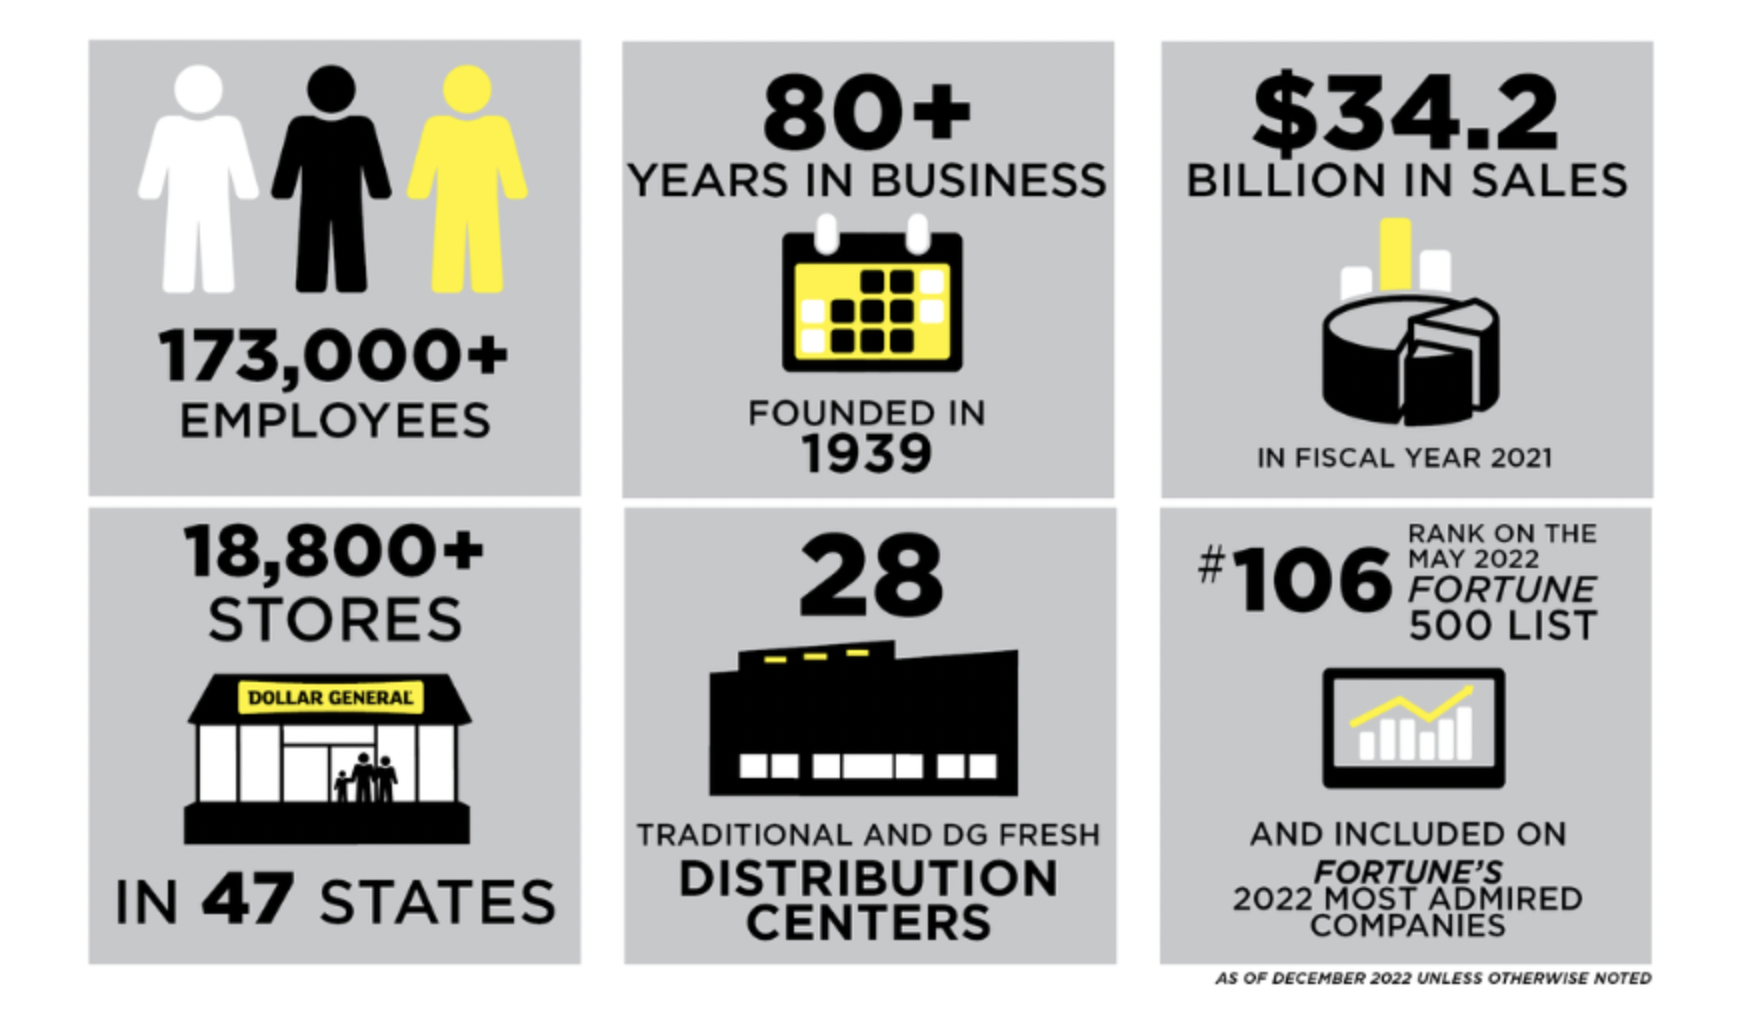
Dollar General are among the largest discount retailers in the United States by number of stores.
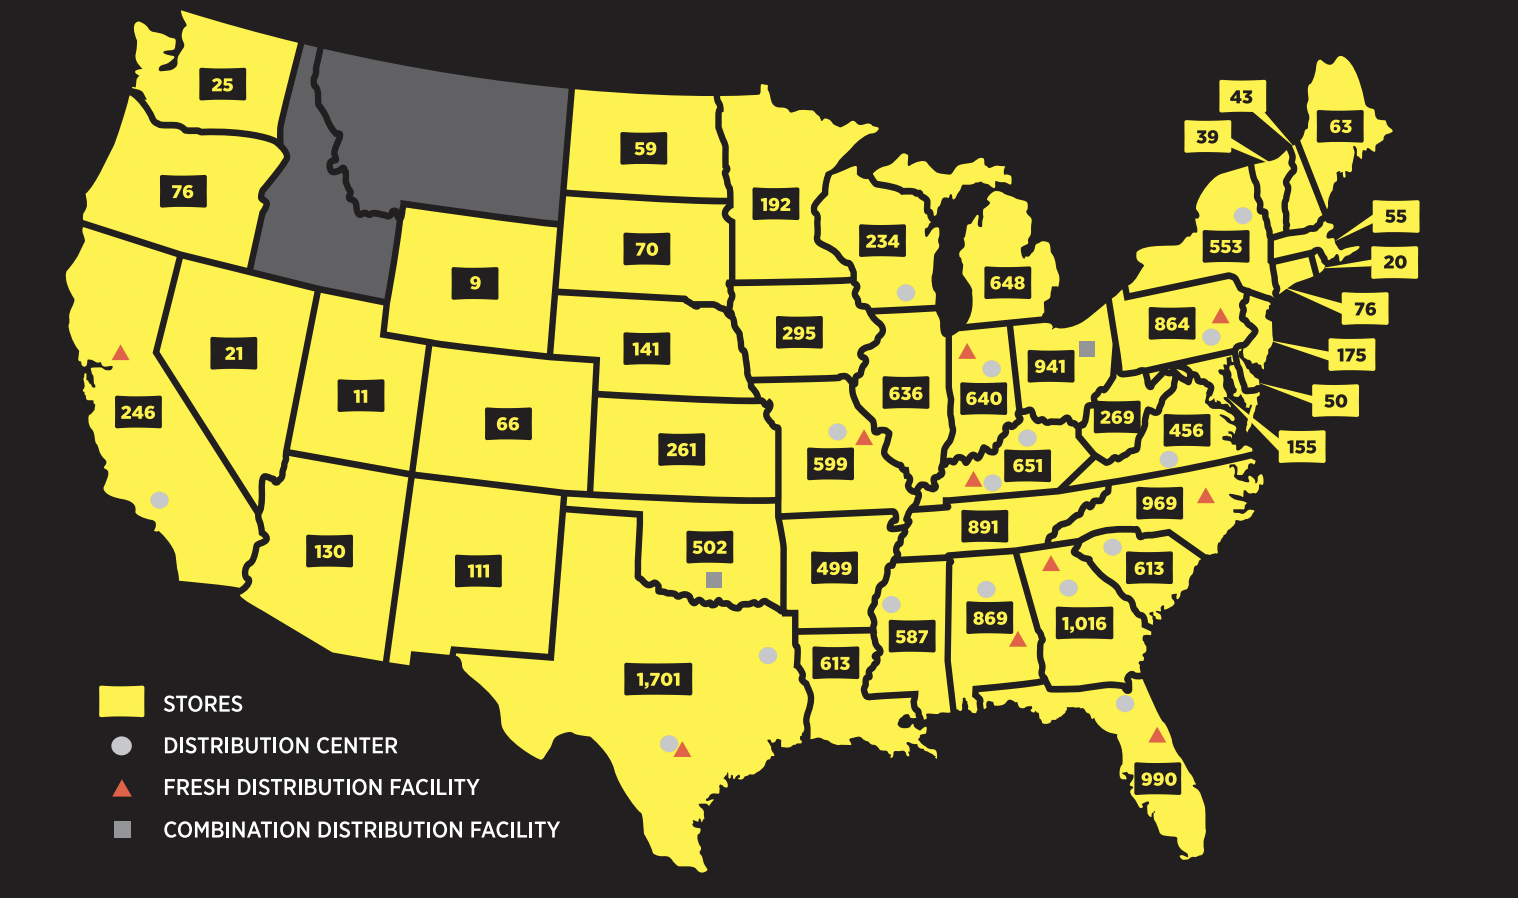
They have the greatest concentration of stores in the southern, southwestern, midwestern and eastern United States.
They offer a broad selection of merchandise, including consumable items, seasonal items, home products and apparel.
Employees: 143,000
Revenue: $36.29B for Fiscal 2022
HQ Location: Goodlettsville, Tennessee U.S.
What they do:
‘Serving Others’
They help shoppers save time and money every day by offering products that are frequently used and replenished, such as food, snacks, health, and beauty aids, cleaning supplies, basic apparel, housewares, and seasonal items at everyday low prices in convenient neighborhood locations.
They operate in 18,818 stores in 47 states as of October 28, 2022.
They also sell products from America's most-trusted manufacturers such as Clorox, Energizer, Procter & Gamble, Hanes, Coca-Cola, Mars, Unilever, Nestle, Kimberly-Clark, Kellogg's, General Mills, and PepsiCo.

Their vision and priorities:
Driving profitable sales growth
Capturing growth opportunities
Leveraging and reinforcing its position as a low-cost operator
Investing in their diverse teams through development, inclusion and empowerment
Outlook 2023
Net sales growth in the range of approximately 5.5% to 6%, including an anticipated negative impact of approximately two percentage points due to lapping the fiscal 2022 53rd week
Same-store sales growth in the range of 3.0% to 3.5%
Diluted EPS growth in the range of approximately 4% to 6%, including anticipated negative impacts of the following:
approximately three percentage points due to higher interest expenses in fiscal 2023, and
approximately four percentage points due to lapping the fiscal 2022 53rd week
This Diluted EPS guidance assumes an effective tax rate in the range of approximately 22.5% to 23.0%
Share repurchases of approximately $500 million
Capital expenditures, including those related to investments in the Company’s strategic initiatives, in the range of $1.8 billion to $1.9 billion
Things to know right now
John Garrent Intention to Retire
John Garratt intends to retire from his position as President and Chief Financial Officer (CFO) effective June 2, 2023. Taking into account its robust succession plans, Dollar General will evaluate options for its next CFO and is not currently conducting an external search.
Dollar General and Delish Partner
Dollar General recently partnered with Delish magazine and Mary Alice Cain, a registered dietician and nutritionist, to create five new Better For You recipes with options for breakfast, lunch, and dinner. Each recipe also includes recipe recommendations to make the dish “Better For You,” and the majority of ingredients for all recipes can be found at more than 19,000 Dollar General stores.
Operating Business Segment:
Competitors
Costco
Target
Burlington Industries
Walmart
Dollar Tree
Dollar General
Their financial calendar
Q1: February-April - Around 26th May 2023
Q2: May-July - Around 25th August 2023
Q3: August -October - Around 1st December 2023
Q4: November -January - Around 11th March 2024
Next Earnings Report:
26th May 2023
Positives from the last earnings report Q4FY22:
Net sales increased 17.9% to $10.2 billion in the fourth quarter of 2022 compared to $8.7 billion in the fourth quarter of 2021.
Net sales for the 53rd week of fiscal 2022 were $678.1 million. The net sales increase was primarily driven by positive sales contributions from new stores and growth in same-store sales, partially offset by the impact of store closures.
Same-store sales increased 5.7% compared to the fourth quarter of 2021, driven by an increase in average transaction amount, partially offset by a modest decrease in customer traffic. Same-store sales in the fourth quarter of 2022 included growth in the consumables category, partially offset by declines in each of the apparel, home, and seasonal products categories.
Operating profit for the fourth quarter of 2022 increased 17.1% to $933.2 million compared to $796.7 million in the fourth quarter of 2021.
The effective income tax rate in the fourth quarter of 2022 was 23.2% compared to 21.2% in the fourth quarter of 2021. This higher effective income tax rate was primarily due to decreased income tax benefits associated with stock-based compensation, and a higher state effective income tax rate compared to 2021.
The Company reported net income of $659.1 million for the fourth quarter of 2022, an increase of 10.3% compared to $597.4 million in the fourth quarter of 2021. Diluted EPS increased 15.2% to $2.96 for the fourth quarter of 2022 compared to diluted EPS of $2.57 in the fourth quarter of 2021.
Challenges from the last earnings report Q4FY22:
Gross profit as a percentage of net sales was 30.9% in the fourth quarter of 2022 compared to 31.2% in the fourth quarter of 2021, a decrease of 35 basis points. This gross profit rate decrease was primarily attributable to an increased LIFO provision, which was driven by higher product costs; a greater proportion of sales coming from the consumables category, which generally has a lower gross profit rate than other product categories; and increases in inventory shrink, damages and markdowns; partially offset by higher inventory markups and a reduction in transportation costs.
Selling, general and administrative expenses (“SG&A”) as a percentage of net sales were 21.7% in the fourth quarter of 2022 compared to 22.0% in the fourth quarter of 2021, a decrease of 29 basis points. The primary expenses that were a lower percentage of net sales in the current year period were retail occupancy costs, incentive compensation, and retail labor; partially offset by certain expenses that were a greater percentage of net sales in the current year period, primarily utilities.
Highlights in FY22:
Fiscal year 2022 net sales increased 10.6% to $37.8 billion compared to $34.2 billion in fiscal year 2021. Net sales for the 53rd week of fiscal 2022 were $678.1 million. The net sales increase was primarily driven by positive sales contributions from new stores and growth in same-store sales, partially offset by the impact of store closures. Same-store sales increased 4.3% compared to fiscal year 2021, driven by an increase in average transaction amount, partially offset by a modest decline in customer traffic. Same-store sales in the fourth quarter of 2022 included growth in the consumables category, partially offset by declines in each of the apparel, home, and seasonal products categories.
SG&A as a percentage of net sales was 22.4% in fiscal year 2022 compared to 22.2% in fiscal year 2021, an increase of 25 basis points. The primary expenses that were a higher percentage of net sales in the current year were utilities, retail labor, and repairs and maintenance; partially offset by certain expenses that were a lower percentage of net sales in the current year, including incentive compensation and retail occupancy costs.
Operating profit for fiscal year 2022 increased 3.3% to $3.3 billion compared to $3.2 billion in fiscal year 2021.
Challenges in FY22:
Gross profit as a percentage of net sales was 31.2% in fiscal year 2022, compared to 31.6% in fiscal year 2021, a decrease of 37 basis points. The gross profit rate decrease in 2022 was primarily attributable to an increased LIFO provision, which was driven higher by product costs; a greater proportion of sales coming from the consumables category, which generally has a lower gross profit rate than other product categories; and increases in inventory markdowns, damages and shrink; partially offset by higher inventory markups and an improvement in transportation costs.